Surveying at the Water Line
First published in the March 2019 issue of Quarry Management
Phil Mills, director of Oakley Aerial Surveys, has been investigating the ability of a small unmanned aircraft to gather accurate survey data in areas of standing water
Occasionally there is a requirement to survey sites where standing water is present. If there are earlier plans prior to flooding it will be possible to calculate the depth of this water. On other occasions when there are no up-to-date plans, it may be necessary to measure the depth from a boat. This situation could occur at an old quarry where there may be a number of such areas, which could differ substantially in depth.
This investigation tested whether data captured using a small unmanned aircraft (SUA) could measure reasonable depths of water and to determine at what depth the level of accuracy became unacceptable. It included a general assessment of accuracies achieved on adjacent areas.
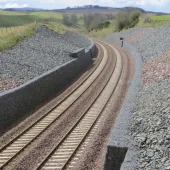
The Derwent Reservoir was chosen as a suitable location for this test because it has a known slope underwater against which to test the surveyed detail. In addition, the area has complex relief (65m height difference between highest and lowest points) to provide a challenging flight environment, together with hidden/obscured detail to test the image resolution. Downstream of the dam there is a weir system leading into the river Derwent and adjacent fields often have lying water.
Method
The survey was carried out using a QuestUAV Q200 fixed-wing aircraft, capable of productive flights lasting more than 45min in winds of up to 35 miles/h. An appropriate flight plan was drawn up in advance which covered the area of interest in addition to the land on the downstream side of the dam, which is owned by Northumbrian Water.
On the day of the survey the weather was calm, dry and overcast with variable visibility. A calm day had been specifically chosen for the test so that there would be minimal rippling of the water surface, in order to achieve the best possible results for the underwater detail.
Maintaining control
Before flying, control markers were placed around the site and surveyed using a Trimble GPS receiver referencing an on-site base station. Repeat measurements were taken at these points to ensure accuracy and the mean position of each point was taken to be correct. These control points were used later in the process to refine an initial alignment of the photography. An additional 77 check points were taken across the site, sampling various surfaces, including roads, water level and vegetation of varying height and density. These points would act as independent checks against the final model, in order for a statistical analysis to be conducted. They played no role in the production of the final model.
Survey flight
During the flight, which took place 300ft above the water, survey data were captured in the form of high-resolution still photographs. Over the course of the 22min flight some 61ha were covered, with more than 600 photographs captured in the process. These were processed using Agisoft Photoscan, in conjunction with the ground control data, to produce accurate 3D co-ordinates and orthomosaics.
Once the final models had been completed the resulting point cloud was exported to a specialist survey package to compare against the ground survey check points.
Results on land
Table 1 summarizes the results of the flight, when compared with the ground survey check points. Points have been grouped into categories to reflect the different features to which they were related. ‘Identifiable’ point accuracy is in XYZ, the remainder in Z (height) only.
On soft surfaces the mean value is used to apply a generic height correction to vegetation areas. The water level of the reservoir, as recorded by the flight, agreed with the surveyed level, the spread of readings being 2cm.
Blocked drains
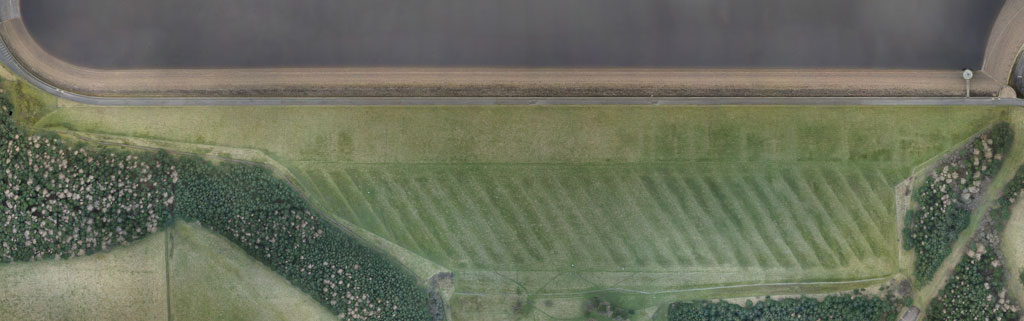
The survey also highlighted a number of additional aspects. The field drains downstream from the dam are clearly identifiable: they are seen as changes in grass texture and colour on the orthomosaic
(fig. 1) and as waves in the contour drawing (fig. 2). On the grassed downstream face of the dam the location of the uppermost drainage blanket is also clearly visible along half of the dam, again shown by changes in grass colour. Along the middle section of the dam there is no visible evidence of the blanket. In discussion with Northumbrian Water it was concluded that this was most likely to have been due to drains in that section having become blocked over the course of the 50 years they had been in situ. Also present and identified are small areas of water within the grassed area, which show as dark patches at the south end of the dam near the woodland and in the field north of the visitor centre.
Results under water
Whilst the underwater detail lacks clarity in the photography, Photoscan was able to produce a reasonable ground model to a water depth of around 1.5m. Down to a depth of 0.4m the model was fairly smooth, after this point levels of noise in the generated surface increased substantially. Even so, by taking the lowest point in the main part of the point cloud reasonable estimates of water depth (within 15% of real depth) could be calculated to a depth in excess of 1m (fig. 3).
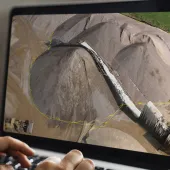
Underwater detail was only visible on vertical or near-vertical images, where the effect of refraction is minimal (fig. 4). At oblique angles only reflections from the water surface were visible. In this sense the water acted as a ‘self-filter’ for this technique. Because the underwater imagery is only present at near-vertical angles, the heights calculated will never be as accurate as those of ground points.
Conclusion
The results obtained showed that reasonable estimates can be obtained for clear-water depths down to 1.5m. Successful commercial use of this method would require understanding of the methods of data collection, how to extract the relevant data and the limitations to the accuracy of such data.
The survey carried out for this experiment was designed and planned in advance in order to give the best possibility of producing a good underwater model. The repeatability of these results in less than ideal conditions is unknown.
The initial requirement to test whether it is possible to calculate reasonable estimates of depths of shallow standing water from aerial photography was met.
It was also possible to identify shallow underground features, for example underground pipes/membranes as well as lying surface water. Whilst such features can be quickly identified from the aerial data, additional specialist knowledge of the site is required to interpret the results and determine their significance, possibly prior to commissioning a much more detailed investigation. For further information visit: www.oakleyaerialsurveys.co.uk
- Subscribe to Quarry Management, the monthly journal for the mineral products industry, to read articles before they appear on Agg-Net.com