Developments In Directional Dust Monitoring
Low-cost directional dust monitoring around mineral workings
Qualitative measurements of soiling using sticky pads to collect dust have been in use since the 1980s. Early analysis used smoke-stain reflectometers that provided results known to be of limited scope, subjective and non-repeatable. The first quantitative analysis of slides, using computer-based analytical techniques, was developed at Leeds University1. This technology has been further developed during a recent Mineral Industry Sustainable Technology (MIST) programme.
Comparative field-monitoring trials have been directed towards the definition of limits of nuisance dust around minerals operations. Directional monitoring of dust is the only way to gain information on movements of dust around a site and to locate the primary dust sources. This is especially important where deposited dust is remobilized one or more times (ie recycling of dust).
Directionality is of particular relevance when an operator is alleged to be causing a dust nuisance; in many cases a sizeable proportion of dust deposited in close proximity to minerals sites emanates from other activities (notably farming and transport).
Dust emissions from quarrying and other industrial activities can give rise to conflict between minerals/quarry operators and local residents. Deposited (nuisance) dust — typically 30–50µm (microns) — is one of the main causes of complaint, and fears are increasingly expressed in relation to alleged health effects of finer particulates (PM10 or 10µm dust)2. It is, therefore, becoming ever more important that the sources, as well as the quantity of dust arising at the receptor site, are known. Where dusts from multiple sources are an issue, colour, size fraction and mineralogy should also be considered. The DustScan system can measure these parameters directly from any direction as well as preserving the deposited dust for further analysis.
The basic monitoring techniques used in Britain are:
- Active monitoring systems. These generally draw in known volumes of air for a designated period and measure the amount (particle concentration and mass) and type of dust (particle size fraction) suspended in the air. These technologies are expensive and may only give very limited directionality.
- Passive systems. These comprise deposit gauges of various types, the most popular being the frisbee gauge. Deposit gauges use a similar principle of collecting dust in an upturned vessel. This dust is then weighed. The glass-slide technique is another method where soiling is measured as the change in reflectance or dusting rather than mass. Neither system gives directional information nor differentiates between dusts of different colour or density.
- Flux gauges. These sample dust that flows past a monitoring point. Gauges such as the BS 1747 directional gauge comprise four slotted cylinders and give limited directional information. A vertically-mounted cylindrical sticky pad, as used in DustScan, is also a form of flux gauge but one that can provide full directional monitoring and rapid quantitative analysis.
DustScan equipment
The DustScan system was developed during a TCS project funded by the Department of Trade and Industry in conjunction with the Mining Department at Leeds University; it has been further enhanced during the MIST project with funding from the Aggregate Levy Sustainability Fund (ALSF). This allowed for calibration of the analytical techniques to give rapid and repeatable measures of nuisance dust.
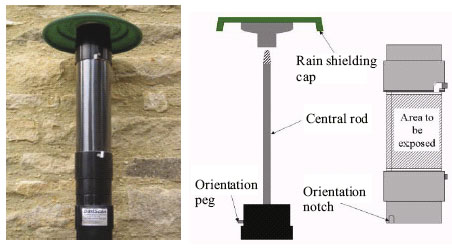
The DustScan field equipment, which has been designed to be robust, inexpensive and unobtrusive, comprises four main components: the stand, mounting cylinder, collection slide and carrying flask (fig. 1).
The stand is a post to which the mounting cylinder is fitted and held in place with a screw-on rain cap. It is installed by setting in concrete, fixing in a steel post holder or attaching to an existing structure. The north position is fixed by inserting a peg into the stand in the appropriate position. The mounting cylinder holds a dust-collection slide (sticky pad) that provides a 360° exposure around the installation. The collection slide is designed to fit the cylinder exactly and has pre-scored backing paper to allow simple exposure and sealing. A lug located on the cylinder orientates it to north by fitting into the peg on the stand. The collection slide is pre-punched and scored to fit over locating pegs on the mounting cylinder to ensure consistent orientation. The pegs also act as bayonet fastenings for securing collars to hold the collection slide in place. An unexposed section of the slide acts as a clean reference area and is tucked inside the mounting cylinder. A carrying flask is used to prevent sample contamination after removal from the stand.
Following exposure the slides are sealed to give a permanent record of collected dust for additional investigations (geochemical, mineralogical etc) or proof of evidence. The samples are scanned on a flat-bed scanner and saved in uncompressed TIFF format. These image files comprise the raw digital data for subsequent analysis. The processing steps are:
- Active monitoring systems. These generally draw in known volumes of air for a designated period and measure the amount (particle concentration and mass) and type of dust (particle size fraction) suspended in the air. These technologies are expensive and may only give very limited directionality.
- Passive systems. These comprise deposit gauges of various types, the most popular being the frisbee gauge. Deposit gauges use a similar principle of collecting dust in an upturned vessel. This dust is then weighed. The glass-slide technique is another method where soiling is measured as the change in reflectance or dusting rather than mass. Neither system gives directional information nor differentiates between dusts of different colour or density.
- Flux gauges. These sample dust that flows past a monitoring point. Gauges such as the BS 1747 directional gauge comprise four slotted cylinders and give limited directional information. A vertically-mounted cylindrical sticky pad, as used in DustScan, is also a form of flux gauge but one that can provide full directional monitoring and rapid quantitative analysis.
DustScan equipment
The DustScan system was developed during a TCS project funded by the Department of Trade and Industry in conjunction with the Mining Department at Leeds University; it has been further enhanced during the MIST project with funding from the Aggregate Levy Sustainability Fund (ALSF). This allowed for calibration of the analytical techniques to give rapid and repeatable measures of nuisance dust.
The DustScan field equipment, which has been designed to be robust, inexpensive and unobtrusive, comprises four main components: the stand, mounting cylinder, collection slide and carrying flask (fig. 1).
The stand is a post to which the mounting cylinder is fitted and held in place with a screw-on rain cap. It is installed by setting in concrete, fixing in a steel post holder or attaching to an existing structure. The north position is fixed by inserting a peg into the stand in the appropriate position. The mounting cylinder holds a dust-collection slide (sticky pad) that provides a 360° exposure around the installation. The collection slide is designed to fit the cylinder exactly and has pre-scored backing paper to allow simple exposure and sealing. A lug located on the cylinder orientates it to north by fitting into the peg on the stand. The collection slide is pre-punched and scored to fit over locating pegs on the mounting cylinder to ensure consistent orientation. The pegs also act as bayonet fastenings for securing collars to hold the collection slide in place. An unexposed section of the slide acts as a clean reference area and is tucked inside the mounting cylinder. A carrying flask is used to prevent sample contamination after removal from the stand.
Following exposure the slides are sealed to give a permanent record of collected dust for additional investigations (geochemical, mineralogical etc) or proof of evidence. The samples are scanned on a flat-bed scanner and saved in uncompressed TIFF format. These image files comprise the raw digital data for subsequent analysis. The processing steps are:
- Initial processing to mask out areas not to be used in the analysis (such as flies, seeds, fingerprints etc). The reference area is then set and a calibration value established for each individual slide, against which the soiled area is compared.
- The dust levels for each sample are assessed individually with approximately 150,000 data points analysed per sample. The process is reliable, non-subjective and quite repeatable.
- Dust levels on each slide are calculated using two different but complementary methods. The first measure is absolute area coverage (AAC%). This is a measure of the proportion of an area that has been dusted, irrespective of dust colour. DustScan evaluates the presence or absence of dust for each pixel in the scanned image against the unexposed reference area.
- The second measure is effective area coverage (EAC%). This measure considers the colour of the dust, which is linearly related to reflectance, and is calculated by comparing the change in colour intensity of the slide where dust is present against the unexposed reference area (see fig. 2).
The output provides both AAC and EAC measures of soiling around the full 360° exposure area. The analysis provides data at less than 1° steps but, for presentation purposes, the results are normally recorded and displayed in 5° or 15° arcs about the monitoring point. The resultant rose diagrams clearly display the directions from which dust has emanated, partly, at times, from beyond the quarry (see fig. 3).
The latest research programme took place during 2003–2004. It comprised extensive field trials using DustScan with other equipment, mostly non-directional. The aim of the field trials was to establish, where possible, a correlation between the various soiling indices and to build a database of comparative monitoring to aid in the definition and limits of nuisance dust. Sites included inter alia sand and gravel workings, hard rock quarries, landfill sites and recycling facilities. Ultimately it is intended that this and future work will lead to standardized protocols for dust monitoring accepted by the quarrying industry and relevant regulatory authorities.
Limits for nuisance dust
Currently there are no legal or policy frameworks for the routine monitoring of nuisance dust adjacent to mineral workings. Planning conditions often use very general phrases in relation to pollution such as ‘reduce to a minimum level’ by ‘best possible means’. Similarly, there are currently no specific definitions or universally accepted measures of what constitutes nuisance dust. Such a definition can only be established when nuisance dust can be adequately quantified and the sources of the dust distinguished.
In the absence of legislative standards, ‘custom and practice’ guidelines are often applied in planning conditions for both deposition and soiling rate methods. Unofficial limits of 200mg/m2/day and 20–25 soiling units (SU/EAC%) per week averaged over a four-week period are routinely referred to as threshold values for deposited dust nuisance.
Ideally, a defined nuisance-dust limit should incorporate both mass and colour elements in its derivation. Dust limits set by mass do not take into account either the colour or density of dust. This is important when considering dust of high colour contrast with its background. For example, coal dust is of relatively low mass and high colour contrast and, as such, is likely to give rise to complaints at significantly lower deposition rates (80mg/m2/day) than the custom and practice limits.
The extensive field trials (and data from monitoring at other sites) have generated a body of data from which recommended nuisance-dust limits have been derived. These limits should be related to primary dust sources so that preventative measures may be taken. The two measures of soiling when used together both detect the presence or quantity of dust (AAC%) and the significance of soiling (EAC%). The suggested limiting criteria for nuisance dust is:
- 100% AAC across a single 45° sector over a seven-day period; or
- The dusting effect or discoloration where the EAC is greater than 25% for a 15° sector, within the same period (see fig. 4).
Findings
The field trials and subsequent laboratory analyses have shown that DustScan’s soiling measures may be directly correlated to the other methods and equipment employed for dust monitoring3. However, the degree of correlation is seen to be dependent on several influencing factors including:
- local site activity and the generation of recycled dust
- number of dust sources
- homogeneity of dust sources
- colour and density where more than one dust type is present
- amount and particle size of dust present.
The DustScan method addresses most monitoring requirements because it distinguishes dust derived from different directions and because the measures of soiling taken together are not dependent on the density of the dust collected but do consider the colour of the dust. It has been found that BS 1747 directional gauges may be susceptible to the collection of extraneous material and give poor correlation in directionality as a consequence of only collecting dust in 90° quadrants.
In general:
- The positioning of monitors is critical in the interpretation of results in the context of patterns of dust dispersal.
- When positioned close to dusty activities, these activities and local features dominate source dust directionality over general wind direction and speed.
- Inferences made using deposit gauges in combination with wind-direction data can be misleading, hence frisbee data linked to non-continuous meteorological data are of limited value.
- Glass slides must be individually calibrated prior to exposure for valid correlation to DustScan soiling measures, but have no directional capability.
- Good point correlation can be obtained between DustScan and frisbees when a distinct single dust source is present, but correlation is poor with low or background dust levels (as a result of very fine particles remaining in suspension and not comprising part of the deposited dust mass), or when several dust sources occur over a period. Frisbee gauges are particularly susceptible to deposits of extraneous material such as bird droppings, leaves etc. Dust can be difficult to detect if added maliciously to frisbees but is readily detected if thrown at the DustScan sticky pads.
Essentially, only the DustScan system was able to differentiate between different dust types and different source directions, quantitatively and at low cost. Current investigations are now directed towards ‘fingerprinting’ dust using mineralogical and chemical methods suited to the retention of samples, and to further investigations into the feasibility of checking the quantity of PM10 dust in flux.
Acknowledgements
The authors wish to acknowledge the support of MIST funding, administered by MIRO, and the operators of many quarries who have installed equipment and made available data from a range of dust-monitoring equipment. The views expressed here are those of the authors and not necessarily the operating companies, MIST or MIRO.
References
- FARNFIELD, R.A., and W.J. BIRCH: ‘Environmental dust monitoring using computer-scanned images’, Clean Air, 1997, 27, pp 73–76.
- Environment Agency, Technical Guidance Document (Monitoring) M17, Bristol, 2003.
- Geoffrey Walton Practice, ‘Low-cost, directional monitoring of nuisance dust around mineral workings’, 2004, www.nuisance-dust.org
The authors, Gavin Hull and Hugh Datson, are with DustScan Ltd