Performance By Design
A model for predicting cone crusher performance
A tremendous amount of material is crushed each year by cone crushers, but despite this a detailed knowledge of how cone crushers work from a process point of view is quite poor. This paper presents a model for predicting cone crusher performance. The model can be used as a simulation tool to assist in the design of crushers, allowing any arbitrary design of cone crusher to be studied. If a set of simulations is performed for a given crusher, a ‘crusher performance map’ can be created which can then be used when optimizing a given crushing task or crushing plant.
Sandvik Rock Processing are currently using this performance model to predict the gradings from a new design of ‘fine chamber’ crushers. This will allow the company to offer and supply crushers which are designed to meet the specific demands of fine crushed-product applications with a high level of confidence. Previously manufacturers would either decline such an application or invest in lengthy prototype test work before the application could be released for commercial use. This type of research, however, gives Sandvik the ability to develop new crushing profiles throughout the full range of Hydrocones with relatively short lead times.
Principles of cone crushing
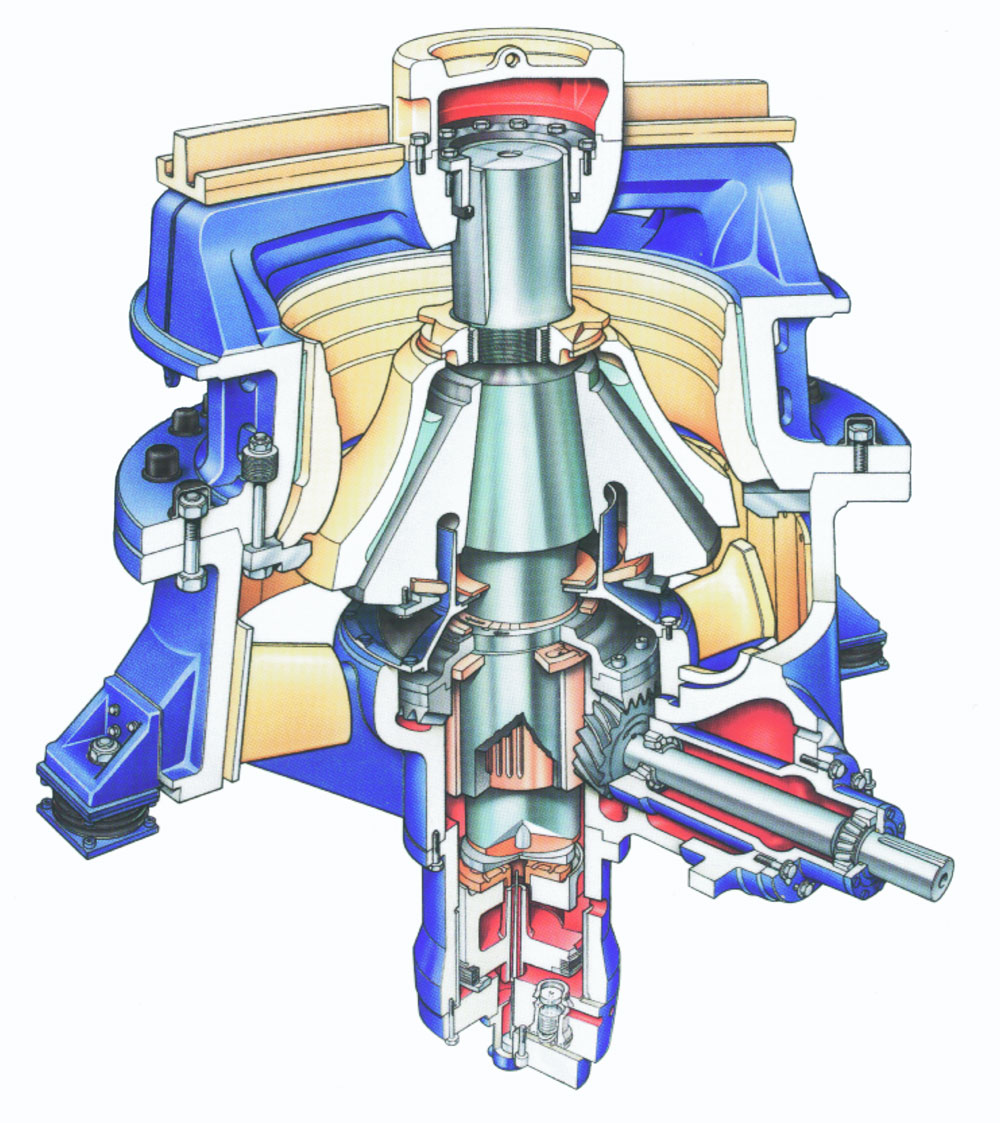
In a cone crusher the rock material is crushed between rigid surfaces. The motion of the moving surface is independent of the loading of the crusher, therefore the explored comminution principle is ‘form-conditioned’ compressive crushing. The crushing action is achieved by an eccentric gyratory movement of the main shaft axis, as shown in figure 1. Particles are nipped, compressed and crushed between the mantle and the concave. Breakage of particles can be both single particle (particles are broken between cone and mantle) and interparticle (between other particles). The mantle and the concave must be replaced regularly as they are subjected to continuous wear.
Crushing takes place continuously and is interparticle to a great extent. Interparticle crushing is achieved when a particle is stressed and broken between other particles. This type of breakage is desirable from the point of view of wear and service life, and is also considered to give the best particle shape. To achieve interparticle breakage choke-fed conditions are normally recommended. Choke-fed conditions imply that the inlet of the crusher is covered with feed material, which is then fed into the crusher under the influence of gravity. The distance between the mantle and the concave at the outlet of the crushing chamber is called the closed-side setting (CSS) when the mantle is in its closed position.
Model development
The overall model for predicting cone crusher performance presented in this paper has been developed in four successive parts:
- size-reduction process modelling
- characterization of rock material breakage behaviour
- flow modelling
- interaction between flow and size reduction.
In figure 2 a structure for the analysis of a cone crusher is shown5. The size-reduction model predicts the size distribution after compressing the rock material. The flow model is important since it describes how the rock material moves down through the crushing chamber. The interaction between the two models is quite complex and intricate, as the overall size reduction in a cone crusher is a result of a repeated consecutive comminution process.
Nominal geometry
Before any simulations can be carried out the nominal crusher chamber geometry has to be encoded numerically. For this reason an input module for geometry was designed5. By means of this generally designed input module, every possible chamber geometry can be treated.
The nominal geometry for a Sandvik Hydrocone crusher is shown in figure 3. Already at this stage it is possible to calculate a set of nominal parameters that characterize the crusher chamber. Nominal stroke snom and bed thickness bnom are determined at every point in a cross-section of the chamber. The ratio between stroke and bed thickness is called the nominal compression ratio and is denoted (s/b)nom. This parameter is central to later predictions of size reduction.
The horizontal cross-sectional area is calculated at all vertical levels. The minimum of the cross-sectional area defines the so-called choke level of the crushing chamber. The location of the choke level is important since it will control the different types of breakage modes in the crushing chamber.
Size-reduction process model
In a cone crusher the incoming feed material is transformed into product by a repeated comminution process. The number of reduction steps varies from crusher to crusher, but it can be ten or more5. An analytical model describing the process should therefore include all these reduction steps. In Figure 4 a model is presented using two basic mechanisms for describing each single reduction cycle, namely selection and breakage1.
The product from one crushing event is the feed to the following event. The size reduction occurring in every single crushing event is described by a selection and a breakage function. Selection (S) corresponds to the probability of a particle being broken, while breakage (B) reflects the way a particle is broken, ie the size distribution of the daughter fragments. It is believed that these two mechanisms can describe all the important aspects of breakage behaviour.
Rock fragmentation characteristics
To quantify the S and B functions laboratory-scale compression crushing tests were performed6.
In the tests the rock material was crushed in a steel cylinder, the equipment being designed to imitate the conditions under which a volume of material is compressed in a real crushing chamber2,3.
The value of selection is obtained directly from the compression tests. The achieved values of S are plotted in figure 5a against the compression ratio which is denoted sÀ. It is clear that the breakage probability S varies both with the compression ratio and with the feed size distribution. The particle size distribution is characterized by its width or spread and is assumed to be reflected by a normalized standard deviation sÀ of the distribution. The value of S increases with increasing sÀ, which is an obvious and natural behaviour. The size distribution width influences the value of S, so that for short fractions higher values of the breakage probability are obtained compared to wide fractions.
The two-variable selection function S(sÀ, sÀ) in equation (1) can satisfactorily describe the breakage probability6. The appearance of the selection function achieved after fitting equation (1) to experimental data is shown in figure 5. The good fit with the experiments confirms the assumption about the behaviour of the selection function.
The breakage behaviour is described with a breakage function B. The breakage function is a cumulative function and the value of B describes the relative amount (by mass) of particles passing a given relative size. For a given original particle size, the breakage behaviour is assumed only to be dependent on the compression ratio. Normalized size distributions resulting from the compression tests with different sÀ ratios are shown in figure 6.
It is obvious that the overall reduction increases when the sÀ ratio increases. A function given in equation (2) with sÀ as a parameter and four constants can be fitted to the experimental data3,6. Here xÀ is a particle size relative to the initial particle size x0. The particle size xÀ is defined in equation (3), in which xmin is a small reference particle size.
For comparison, data for diabase are also shown in figure 63. It can be seen that the two different types of rock have a similar breakage behaviour, although, for a given compression ratio, gneiss generates more fines than diabase.
Flow model
The crushing process is modelled as a series of repeated crushing events. The flow model must therefore predict where, and under which conditions (how), the material is compressed during each size-reduction cycle. For a given rock material, the operators Si and Bi depend on the utilized compression ratio (s/b)u. The utilized compression ratio is always smaller than the nominal compression ratio. The flow model should therefore predict the compression ratio at those points where a material volume is subjected to the crushing events3,4.
The flow model developed is based on equations of motion5. Three different mechanisms are assumed to describe the material flow, namely sliding, free fall and squeezing. By performing repeated strokes it is possible to show how a particle is transported down through the crushing chamber. As the predominant flow mechanism is free fall, this simulation will reveal the fastest possible path a particle can take. Examples of the resulting paths from repeated strokes are shown in figure 7.
From the simulation the so-called crushing zones are defined. A crushing zone corresponds to a volume of material which is crushed when the eccentricity of the main shaft is turned one lap.
Simulation, results and experiments
To validate the crusher flow and size-reduction models, full-scale tests were performed under realistic operating conditions. During the tests both the eccentric speed and the closed-side setting were altered. The crusher chosen for these tests was a Sandvik Hydrocone equipped with a fine crushing chamber.
The model’s response to changes in closed-side setting matches the full-scale tests very well. The number of interparticle crushing zones (#IP) decreases when the CSS increases. This is a consequence of an upward movement of the choke level with increasing CSS. The effect is strongly dependent on the specific crusher design and is therefore not necessarily a general behaviour for cone crushers. The most important effect associated with increasing CSS is a decreasing compression ratio. When the compression ratio decreases the overall size reduction also decreases. This effect is obvious but has not previously been proven by this type of simulation. The combined effect of a decreasing number of crushing zones and decreasing compression ratio is an overall decrease in size reduction.
In figure 8a size distributions are shown for various closed-side settings. The corresponding crusher performance map is shown in figure 8b. For com-parison, full-scale test results are shown in figure 9. The similarities between the simulations and the test results are convincing. The qualitative agreement is especially good in terms of the locations of maximal relative capacities and the trends of the different fractions.
Conclusions
A calculation method with a modular structure based on a deductive crusher model has been developed. The model presented is a comprehensive analytical tool for predicting cone crusher performance and provides a detailed understanding of how and where size reduction is achieved in a cone crusher. Full-scale tests have been performed to validate the model and the agreement between the simulated results and the experimental data is very good.
If a set of simulations is performed for a given crusher a crusher performance map can be created, which in turn can be used when optimizing a given crushing task or a crushing plant. The crusher performance map describes how the product output from the crusher varies with the machine parameters. By applying optimization criteria to the crusher performance map the best operating conditions can be found.
Three main factors are identified to promote the size-reduction process occurring in a cone crusher7. They are: breakage modes; number of crushing zones; and compression ratio. These main factors are affected by crusher design, rock material and operating parameters. For a given crusher application, the factors depend on eccentric speed, CSS and feed size distribution. These three main factors offer the possibility of a fundamental and detailed understanding of how a cone crusher operates, and any design consideration should be evaluated against them.
The model is capable of establishing a direct correlation between crusher design parameters, rock fragmentation behaviour and crusher performance, and can be used as a simulation tool to assist in the cone crusher design process. Any arbitrary design can be studied and different machine layouts can be compared and evaluated early in the design stage. Improvements in crusher design can be made without excessive testing. The cone crusher perfor-mance model gives manufacturers the ability to produce customized crushing chambers.
There are numerous improve-ments and extensions that can be made in the future. At present the simulation tool is able to predict both crusher capacity and product size distribution from cone crushers, but there are no inherent limitations on extending the model to also predict other desired features such as product quality, crusher wear and power consumption. The formulation of size-reduction strategies will further improve the fundamental understanding of the size-reduction process. The size-reduction process does not necessarily need to utilize form-conditioned compressive crushing, but could use any comminution principle.
References
- EVERTSSON, C. M.: ‘Prediction of size distributions from compres-sing crusher machines’, Proceedings EXPLO 95 Conference, 1995, Brisbane, Australia, pp173–180.
- EVERTSSON, C. M.: ‘Prediction of cone crusher performance’, Lic. Eng. Thesis, 1997, Machine and Vehicle Design, Chalmers University of Technology, Göteborg, Sweden.
- EVERTSSON, C. M., and R. A. Bearman: ‘Investigation of interparticle breakage as applied to cone crushing’, Minerals Engineering, 1997,vol. 10, pp199–214.
- EVERTSSON, C. M.: ‘Output prediction of cone crushers’, Minerals Engineering, 1998, vol. 11, pp215–232.
- EVERTSSON, C. M.: ‘Modelling of flow in cone crushers’, Minerals Engineering, 1999, vol. 12, pp1,479–1,499.
- EVERTSSON, C. M.: ‘Size reduction in cone crushers’, Minerals Engineering Conference 1999, Falmouth, England.
- EVERTSSON, C. M.: ‘Cone crusher performance’, PhD Thesis, 2000, Machine and Vehicle Design, Chalmers University of Technology, Göteborg, Sweden.
The author, C. Magnus Evertsson, is assistant professor of machine and vehicle design at Chalmers University of Technology, Goteborg, Sweden