Dust Monitoring Maps — The Way Forward
New techniques in environmental dust monitoring and analysis
By Ben Williams, environmental scientist, and Prof. Geoffrey Walton, managing director, DustScan Ltd
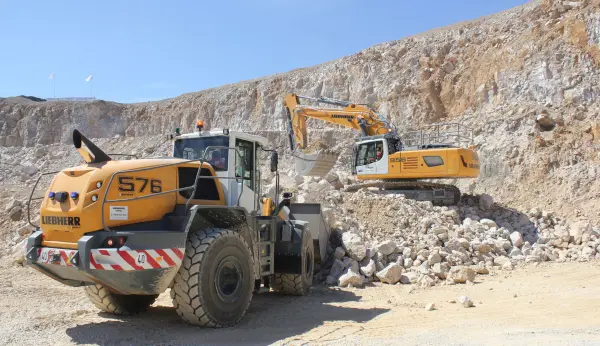
Dust control is a problem at many sites and the distribution of dust from quarries can be contentious. It is, however, apparent that quarries are seldom the only or even the most important source of dust in the area in which they operate. At one recently investigated quarry in eastern England the majority of the dust falling or intercepted at the quarry boundary arose from arable farming activities and not from the quarry.
Unfortunately, many dust investigations fail to consider the spread, or extent, of dust from all the existing dust sources in and near a quarry, or appreciate how to assess dust information collected for environmental impact assessments (EIAs). The key questions are what information should be collected and how it should be used. Unless the appropriate information is collected, it will not be possible to check that dust-suppression methods are working, or that other sources of dust are not contributing to perceived problems. It is essential in dust-monitoring and dust-distribution issues to know three things: first, where the dust is coming from – both the pathway and the source; secondly, how much dust there is from this source or sources; and thirdly, what are the characteristics of the dust, ie what is in it.
Obviously, more information, including site characteristics and meteorological data, is needed for predictive modelling, but most quarries rely on monitoring to check on compliance and even if monitoring is undertaken as part of an EIA, modelling of existing dust distribution is seldom undertaken or even attempted retrospectively. There are, however, many advantages that can accrue from mapping and interpreting the distribution of dust.
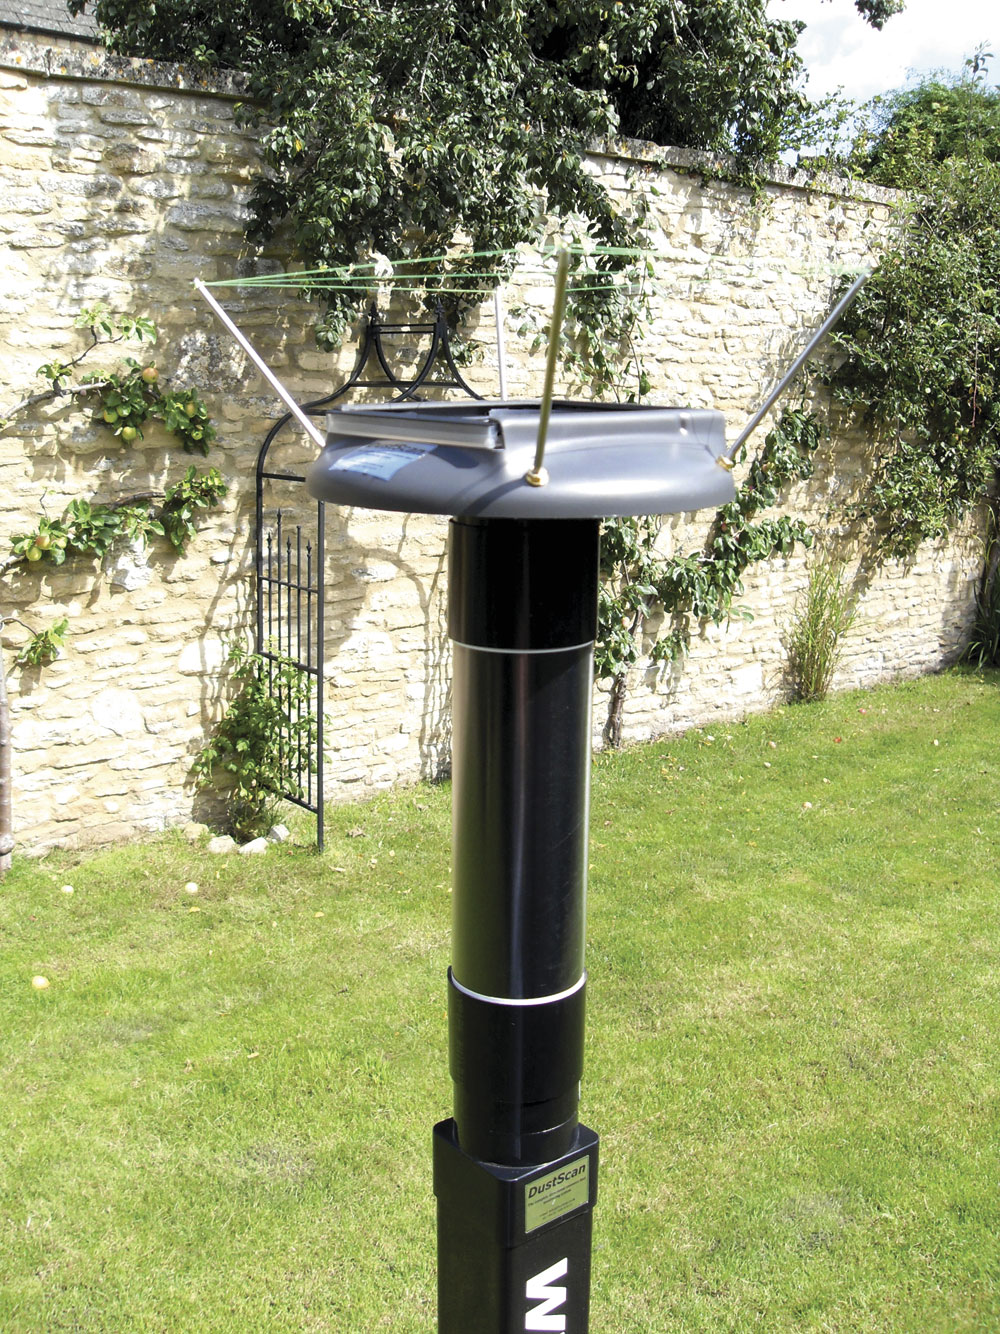
One method of dust sampling that is appropriate for this type of investigation is the DustScan DS100, a directional 360° ‘sticky pad’ monitor. The sampling head allows the user to pinpoint the directions from which dust emissions have come. This can identify both recognized and unrecognized sources, and act as a means of identifying whether dust-suppression methods are working or if other dust sources, either on-site or beyond the quarry boundary, are important. A network of strategically placed instruments can provide forensic information to counter or assist with legal proceedings or as support for planning applications.
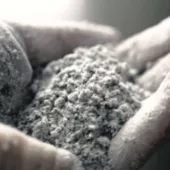
An extension of this approach is currently being developed whereby dust emissions are evaluated on the basis of their chemistry and the intensity of dusting from each direction at a single location. The latter item is supplied by the AAC% values arrived at from monitoring with the DS 100. Sections of the sticky pad (typically 15° sub-sections) are analysed to characterize or ‘fingerprint’ the dust from different directions using advanced methods of chemical analysis. Samples are analysed using inductively coupled plasma – mass spectroscopy (ICP-MS), after first undergoing digestion in powerful acids. The ICP-MS has the ability to identify more than 30 different elements in a pre-selected sub-section of the sticky pad. Elements identified and used are important contaminants such as cadmium, arsenic, copper and lead, but also major elements in many rocks, including aluminium, magnesium, calcium, iron and manganese. These are analysed to parts per billion and the ratios between elements are used to confirm the nature of the dust source. If necessary, it is possible to confirm in great detail the distribution of individual dust particles from a dust source using SEM (scanning electron microscope) techniques, allied to laser-ablation methods for chemical analysis of such particles.
These results can then undergo rigorous data-handling procedures and processing, to assess the proportion of indicative chemical components at each monitoring point with respect to an individual source. This data can, in turn, be further assessed spatially using standard geostatistical tools similar to those employed by some geologists in the minerals sector. With the use of semi-variogram and kriging techniques, maps can be produced showing the distribution of key components of dust originating from a specific source. Maps are produced with colour coding from red and yellow through green to purple and blue, where red is the highest proportion of dust from the source and blue the lowest. The addition of relevant AAC% values to this plan permits an assessment of the significance of the spread of dust from this source at any location.
These methods are now being used to assess the spread of potential contaminants from specific operations connected with the quarrying sector and can be used as the basis for selecting site-specific dust-control methods, especially where critical activities have potential for local concerns. Allegations can be addressed from a position of strength and, if necessary, supported in detail.
It is envisaged that these methods may be of particular assistance to the industry where, associated with quarrying activities, other processes, such as cement or lime manufacture or the stockpiling of hazardous or other wastes, are in progress or where recycling is likely to give rise to concern. In Carboniferous limestone areas where mineral veins occur within a quarry, the dust from that quarry can be identified with considerable confidence and distinguished, for example, from different minerals occurring within dust from superficial deposits covering or surrounding the limestone.
The spatial understanding of the distribution of dust is advancing rapidly and can be used with confidence by quarry operators confronted with alleged dust problems that might lead to litigation. Dust monitoring is now much more than a tick-box exercise.