The Benefits of Visual Dust Monitoring in Quarries
First published in the July 2013 issue of Quarry Management as Seeing is Believing
Dust monitoring is often a regulatory requirement for existing, new or extensions to quarrying operations. SLR Consulting’s senior air-quality consultant, Lucy Hodgins, examines whether dust monitoring always has to involve the use of expensive equipment and evaluates whether visual dust monitoring could provide a cost-effective way of supplementing a quantitative approach.
Dust is characterized by size and is measured in micrometres (μm), a length equivalent to a millionth of a metre. Particles with an aerodynamic diameter up to 10 micrometres in size – about 25 to 100 times thinner than a human hair – are referred to as PM10.
Types of dust range from ‘deposited dust’, which is usually associated with surface soiling and typically comprises particles greater than 30μm, and ‘suspended dust’, which falls into the PM10 range, for which Air Quality Standards exist for the protection of human health.
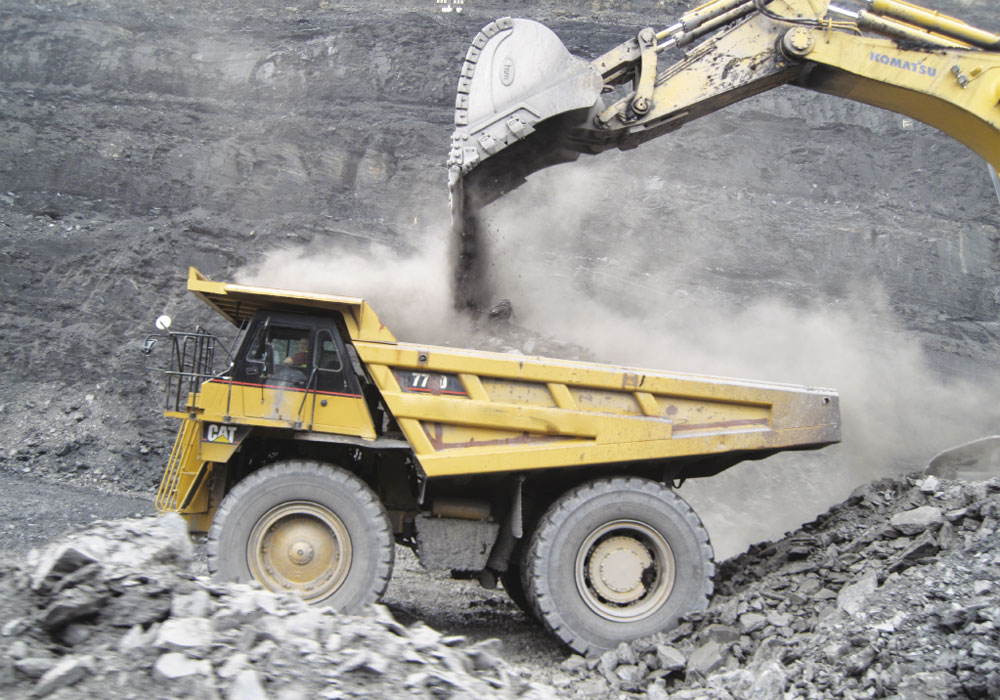
Sources of dust during quarrying may include soil and overburden removal, extraction through blasting or excavation, and general material-handing operations. Processing of material, including crushing and screening, are also potential sources of dust, as well as transportation of material by conveyors or internal haul roads.
Options for dust monitoring
A number of dust-monitoring techniques exist for measuring dust, of which the method of choice is dependent on:
- proximity of the receptor
- size/type of dust
- purpose/aim of the monitoring
- duration of monitoring.
Deposited-dust monitoring
Deposited dust is generally monitored using a range of dust-collection gauges by period averaged sampling. The Environment Agency’s preferred method1, the Frisbee gauge, gravimetrically measures the deposition of dust over the period of exposure by intercepting dust as it travels to the ground. Furnished with ‘sticky strips’ (Fablon sheets), this also allows the directional flux of dust to be determined, through measuring the change in reflectance.
Other methods, which cost from £10 to hundreds of pounds each, include glass slides, directional dust gauges and the BS deposit gauge (BS1747: Part1) furnished with sticky strips.
Suspended particulate matter
Suspended particulate matter (PM10) is generally measured using real-time sampling.
There are a number of monitors available with different monitoring techniques, including: TEOM (tapering element oscillating microbalance); FDMS (Filter Dynamic Measurement System); Partisol; Light Scattering Optical Particle Counter; Beta Attenuation Monitors (BAM); and OPSIS SM200 (mass-configuration sampler).
These instruments can range in price from £1,000 to £25,000, with additional costs incurred through equipment service and maintenance, electricity supply, as well as quality assurance and quality control and management of the data.
Which method?
The dust-monitoring method should be proportional to the assessed risk and appropriate to the issue or levels of concern. Initial equipment costs and subsequent on-going analysis can become very expensive if monitoring is required over a significant period of time, such as the lifetime of the quarry.
In many cases a cheaper, cost-effective approach using visual monitoring may be employed. This could be used as a potential substitute for dust monitoring, or supplement a monitoring scheme. All methods should, of course, be carried out in accordance with best practice.
Benefits of visual monitoring
Considering the importance and benefits of visual monitoring in dust-related issues, the number of quarries currently keeping records is less than expected. However, visual monitoring can make a valuable contribution to the dust-control strategy on site as it provides a constant review of operational dust impacts.
One of the primary benefits is the fact that visual monitoring is comparatively cheap to set up, with the start-up costs being limited to a wind-speed gauge, which vary in price from several hundred pounds for a weather station to around £15–£150 for a handheld anemometer, depending on the model. Ongoing costs relate only to those associated with a member of the existing quarry team being tasked with the daily assessment.
Other key benefits of visual monitoring include:
- quick and simple
- complaint management
- review of mitigation measure effectiveness
- identifying baseline conditions for planning applications
- identifying the occurrence of acute dust events
- monitoring compliance with permit
- demonstration of proactive approach and vigilance to authorities.
Complaint investigation
Potentially costly dust monitoring may be stipulated by local authorities in response to dust complaints made by local residents. Visual monitoring is an important tool to validate any complaints and determine whether the site is the source of dust and whether quantitative monitoring is justified.
Often the operator is only made aware of dust complaints sometime after the dust occasion, either due to complaints being made to the local authority and the site being notified at a later date, or due to local residents complaining after the event.
Without visual monitoring records verification of these complaints to determine whether site operations are actually the source is difficult. Information used in validation includes:
- whether the site identified any dust leaving the boundary
- the wind direction
- whether the complainant was downwind during this period
- site operations at the time, eg whether site operations were normal or whether intermittent dusty operations, such as soil stripping, additional processing plant operational or blasting, were being undertaken.
Sources of dust other than the operator’s site could include neighbouring quarries and construction sites, as well as agricultural dust from ploughing or harvesting.
Widespread dust events such as those that occurred during June 2012, where a dust-laden air mass from the Sahara deposited a thin layer of dust across surfaces in the UK2, can occur a couple of times a year. These events are another potential off-site source of dust. If visual monitoring records are taken, potentially unrelated complaints that would otherwise be attributable to the quarry and noted on the site’s record could be proven not to originate from the site.
Planning applications
Applications for planning permission to extend quarries or Review of Mineral Planning (ROMP) applications require the baseline dust levels to be determined. Visual monitoring can assist in determining existing dust generation, which is specifically required by guidance LAQM.TG(09). This guidance explicitly asks: ‘Does visual inspection indicate significant dust emissions or dust tracked out of the site on to public roads?’. If it is possible to prove there have been no complaints and the answer to the above is ‘No’, detailed assessment (including potentially costly quantitative monitoring or detailed dispersion modelling) can be avoided.
This information also aids in assessing dust-emission risk. If the risk is low, the mitigation measure requirements could be reduced to reflect this, thereby saving on the cost of expensive mitigation equipment.
Mitigation measures review
Visual monitoring allows the efficiency of mitigation measures such as water suppression, road maintenance and management to be reviewed, helping to reduce the chances of a dust event and possible complaints. It allows compliance with any boundary conditions, such as ‘no visible dust across the boundary’, to be assessed and recorded.
This helps alert operators to changes in wind direction and speed, and increases awareness of the occurrence of dust-generating conditions.
The use of visual trigger levels will identify when additional mitigation measures are required, or when modification of operations is required (including the cessation of operations during windy conditions).
All personnel should be trained to use visual triggers to identify unacceptable dust generation. If visual monitoring identifies significant movement of dust across the boundary, this should trigger some operational changes to reduce the levels.
This could either be undertaken through additional mitigation measures, such as increased watering of haul roads, or may involve the reduction or cessation of operations, if the operational source is known, until weather conditions subside. Further visual monitoring should be undertaken to verify the effectiveness of the remedial action, with all steps taken recorded.
Examples of visual triggers to identify unacceptable dust levels include situations where fugitive dust reaches a designated height above ground level, such as the height of cabins or the wheels of dumptrucks, or when visible emissions extend more than about 10m from plant, conveyors or stockpiles.
The lower the dust generation the lower the likelihood of complaints and, therefore, the lower the chance the local authority will request quantitative dust monitoring (which is usually requested if a persistent problem arises).
Methodology
Visual dust monitoring should be undertaken on (at least) a daily basis by either the site operations manager or a designated responsible member of the site personnel. Visual assessments should be undertaken at site boundary locations, the number dependent on the size of the site, but at a minimum of two locations. All locations should be positioned downwind of the current dust-generating activities. In the event of increasing wind speeds and changes in wind direction, the frequency of monitoring should be increased. A daily logbook should be maintained of the visual assessments, an example of which is shown in figure 1.
The operator should keep records of all monitoring and inspections on site for a minimum period of two years, which should be made available if the regulator requests.
Case study: Visual monitoring in practice
The implementation of a daily visual monitoring scheme proved invaluable at Pigsdon Quarry, a gritstone site in Cornwall, where a nearby complainant would communicate directly with the council, resulting in a significant time delay between the specific occasion and the site becoming aware. The council would request information regarding site operations and meteorological conditions to validate the complaint, which the site was able to provide. These visual monitoring records provided, on many occasions, evidence that dust was not necessarily coming from the site.
References
- Environment Agency, Technical Guidance Note (Monitoring) M8, Monitoring Ambient Air, V2, May 2011.
- Dust storm brings Saharan sand to the UK
- Subscribe to Quarry Management, the monthly journal for the mineral products industry, to see articles before they appear on Agg-Net